PPK is a informative source for developments on the web, especially the mobile web. since he turned away from javascript the last years.
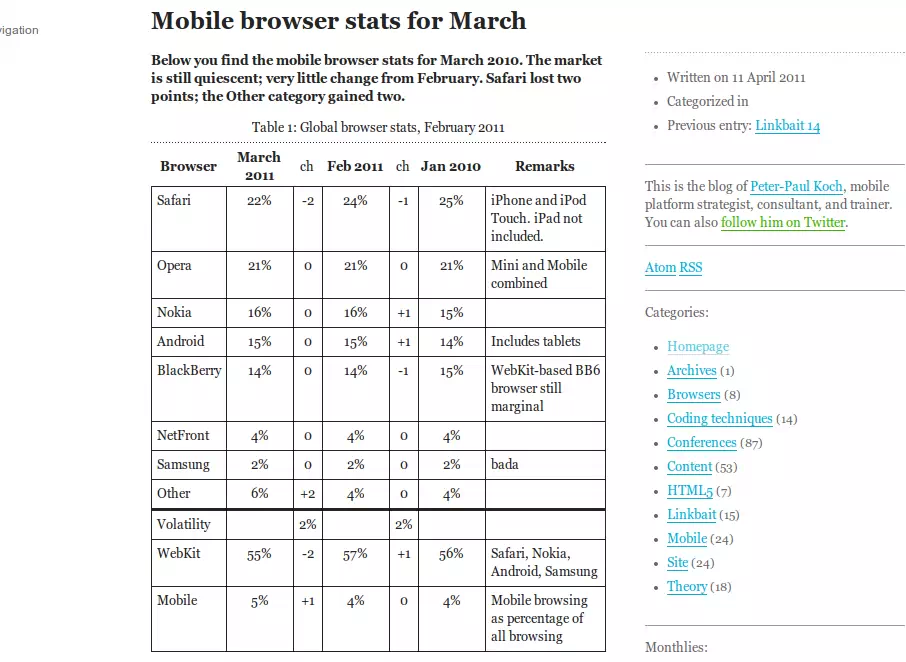
Still I doubt his analysis of his monthly Mobile browser stats can stand the test for science. (Webp image screenshot, saved 45% compared to jpg. supported by Chrome and Opera, click to see jpg) or follow link.
A few questions raised:
- What do I actually see, how is the market share defined?
bandwidth, server logs, requests, time, analytics, users, User Agent strings? - There seems to be mixing up of platforms and browsers: I use Opera on Android, in which row do I belong?
Opera or Android. You expect Opera, but in his words he expected Android to have passed Blackberry. Well, they just put me in the wrong category! - Opera is using compression proxy servers that will lower the bandwidth with up to 50%.
Opera is also pre-formatting content (OBML), compressing images to the new WebP pcture format (much better then jpg), and minimizing the amount of server requests, which is slowing mobile web quite severely. That also makes traffic difficult to measure and compare to other platforms. And then competition has started similar services: Bitstream Bolt and UC browser. - I use my Android mostly at home or at my desk using ADSL landlines. Is that mobile web?
Statcounter should break down their numbers to platform, browser and provider/data carrier. We need to differentiate between WIFI, and GSM/UTMS. Is Mobile web defined by device or by usage/location.
Don’t get me wrong, I really like PPK and his works, and I know he is at least trying to get some order in the chaos of mobile life, and he is working with the data provided by Statcounter.
On the other hand, maybe the absolute numbers are wrong, if you don’t change your methods, trends still remain visible. I keep reading PPK Quirksblog.

